
How to Look Up Santa Cruz County Jail Population Data
Population data is different from a name search. It comes from official reports, not the booking roster. The main source is the state Board of State and Community Corrections, which runs the Jail Profile Survey. That survey collects monthly and quarterly data from county jails, including average daily population and rated capacity where reported. County grand jury and criminal justice reports add local detail.
The BSCC Jail Profile Survey is the official statewide source for jail population figures.
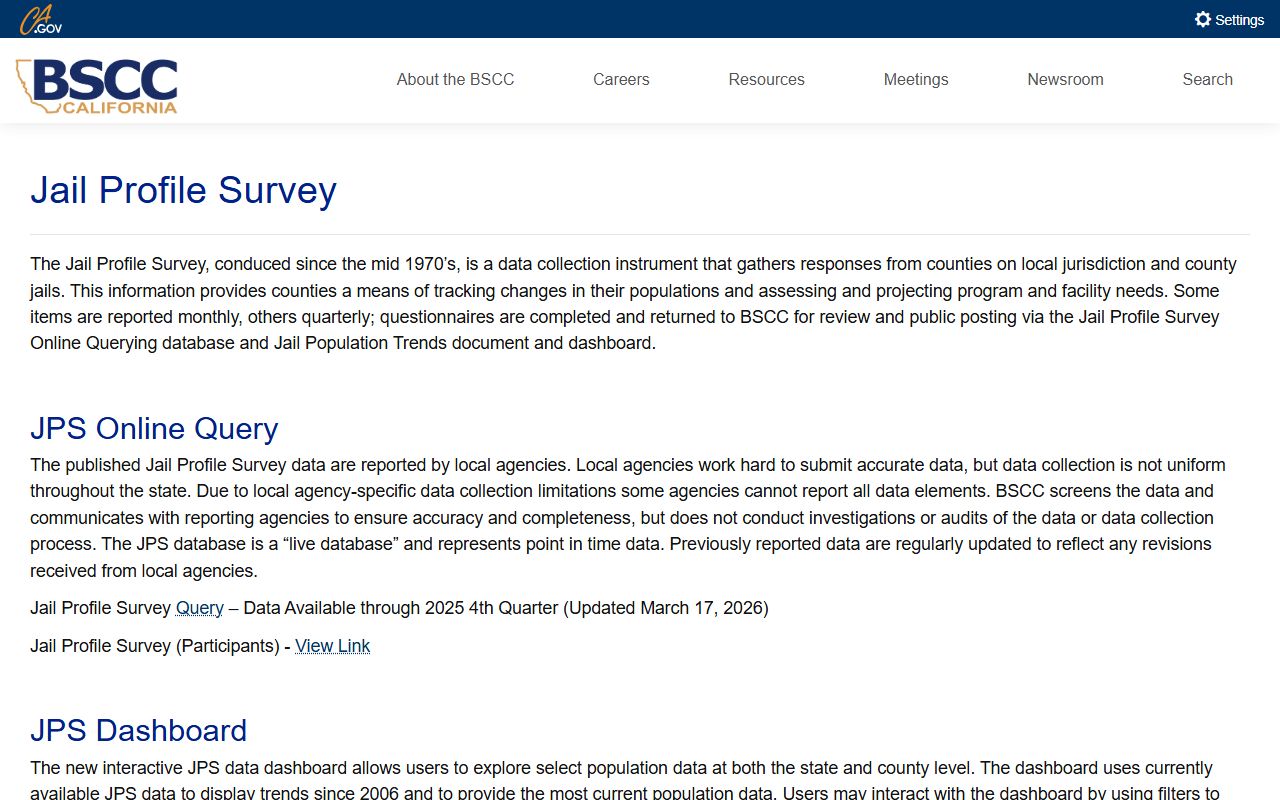
The survey reports by county over time, so it is the right place to track Santa Cruz County jail trends rather than a single day's count.
Santa Cruz County Jail Capacity Overview
The Sheriff operates four corrections facilities. Each plays a different role in the county system. Current rated capacities are not posted on the Sheriff's public pages, so the BSCC survey is the source to confirm those figures before relying on them. The table lists the facilities and their roles.
| Facility | Role | Rated Capacity |
|---|---|---|
| Santa Cruz Main Jail | Booking and reception | See BSCC survey |
| Blaine Street Facility | Family contact visits | See BSCC survey |
| Rountree Facility | Medium security | See BSCC survey |
| Rehabilitation and Reentry | Reentry programs | See BSCC survey |
Because capacity figures are not published in the current Sheriff pages, treat any single number with care and check the state survey for the rated count.
Average Daily Population
Average daily population, or ADP, is the typical count held on a given day across a month. It smooths out the daily ups and downs of bookings and releases. A Santa Cruz County grand jury report referenced a 2023 criminal justice court report with a local figure. During one month in 2022, the average daily population was about 327 incarcerated people. That figure comes from an official county report rather than a live feed.
Because the number is a single month from a report snippet, treat it as a snapshot, not a current count. The BSCC survey carries the official monthly series for a fuller view of Santa Cruz County jail population over time.
Daily counts also swing with arrests, court releases, and transfers, so a single day can sit above or below the monthly average. That is why the average daily figure, not a one-day count, is the standard measure for a jail, and why the Santa Cruz County numbers are best read as monthly averages.
Pretrial vs Sentenced Population
Jails hold two main groups: people awaiting trial and people serving a sentence. The split matters for policy and for understanding the count. In the same 2022 month from the county report, most of the population was pretrial. The table shows the breakdown from that report.
| Group | Count (2022 month, per county report) |
|---|---|
| Pretrial / not sentenced | About 263 |
| Sentenced | About 64 |
| Total average daily population | About 327 |
A large pretrial share is common in California county jails. Verify the figures against the county report and BSCC data before quoting them.
Misdemeanor vs Felony Population
The jail holds people on both misdemeanor and felony matters. Felony cases tend to drive longer stays, while many misdemeanor holds are short. After California's realignment, county jails also hold some people serving sentences that once went to state prison. The current public sources for Santa Cruz County do not break out a precise misdemeanor and felony split.
For that level of detail, the BSCC survey and county criminal justice reports are the place to look. Booking-level charge data shows on each record in the roster, but it is not summed into a public total.
Demographic Breakdown
Population data also covers who is held, by age, sex, and race. These breakdowns help the county and the public understand the jail population and spot disparities. The current public Santa Cruz County sources do not post a full demographic table on a single page, so the state survey is the place to find reported figures.
The BSCC Jail Profile Survey collects demographic data from county jails where it is reported. County criminal justice council reports add local analysis. Booking records in the roster list each person's sex, race, and date of birth, but those fields are not summed into a public demographic total. For any demographic figure, cite the state survey or the county report and note the date, since these numbers shift month to month.
Statewide and national breakdowns from the BSCC and the Bureau of Justice Statistics give context for how the Santa Cruz County mix compares to the rest of California and the country. Keep county, state, and national demographic figures clearly labeled so they are not blended into one number by mistake.
Mental Health and Medical Population
A share of any jail population needs mental health or medical care. The Santa Cruz County jail runs mental health screening, crisis intervention, and psychiatric care, and it partners with County Behavioral Health through the collaborative courts. Those programs aim to move eligible people into treatment rather than long custody.
Exact counts for the mental health and medical population are not published in current public sources. The collaborative courts and Behavioral Health Court connect to this group, and the county's criminal justice reporting is the best source for any figures.
National and State Context
Local numbers make more sense next to the bigger picture. The Bureau of Justice Statistics, a federal agency, publishes national jail data, and the BSCC publishes statewide California figures. National jail data has long shown that a large part of the jail population is held pretrial, which matches the local pattern in Santa Cruz County. People in state prison or federal custody are counted separately and are not part of the county jail total.
The comparison below explains what each official source covers, so you pull the right number from the right place rather than mixing county, state, and national counts.
| Source | Covers | Best For |
|---|---|---|
| County grand jury / criminal justice report | Santa Cruz County jail | Local ADP and pretrial split |
| BSCC Jail Profile Survey | All California county jails | Capacity and monthly trends |
| Bureau of Justice Statistics | National jails and prisons | National context and comparison |
Population Trends Over Time
One month does not show a trend. To see whether the Santa Cruz County jail population is rising or falling, use the BSCC monthly series across several years. That data tracks bookings, releases, and average daily population, which together show the direction. County criminal justice council reports add local analysis of pretrial reform and program effects.
Single snapshots, like the 2022 month above, are useful markers but not a trend line on their own. The state series is the reliable way to chart change.
Searching for Santa Cruz County Inmate Records by Name
This page covers population data, not individual lookups. To find one person in the county jail, use the Sheriff's roster on the Santa Cruz County inmate records page. For someone in federal custody, the count is separate and the federal locator applies.
The BOP inmate locator searches federal custody, which is not part of the county jail population.
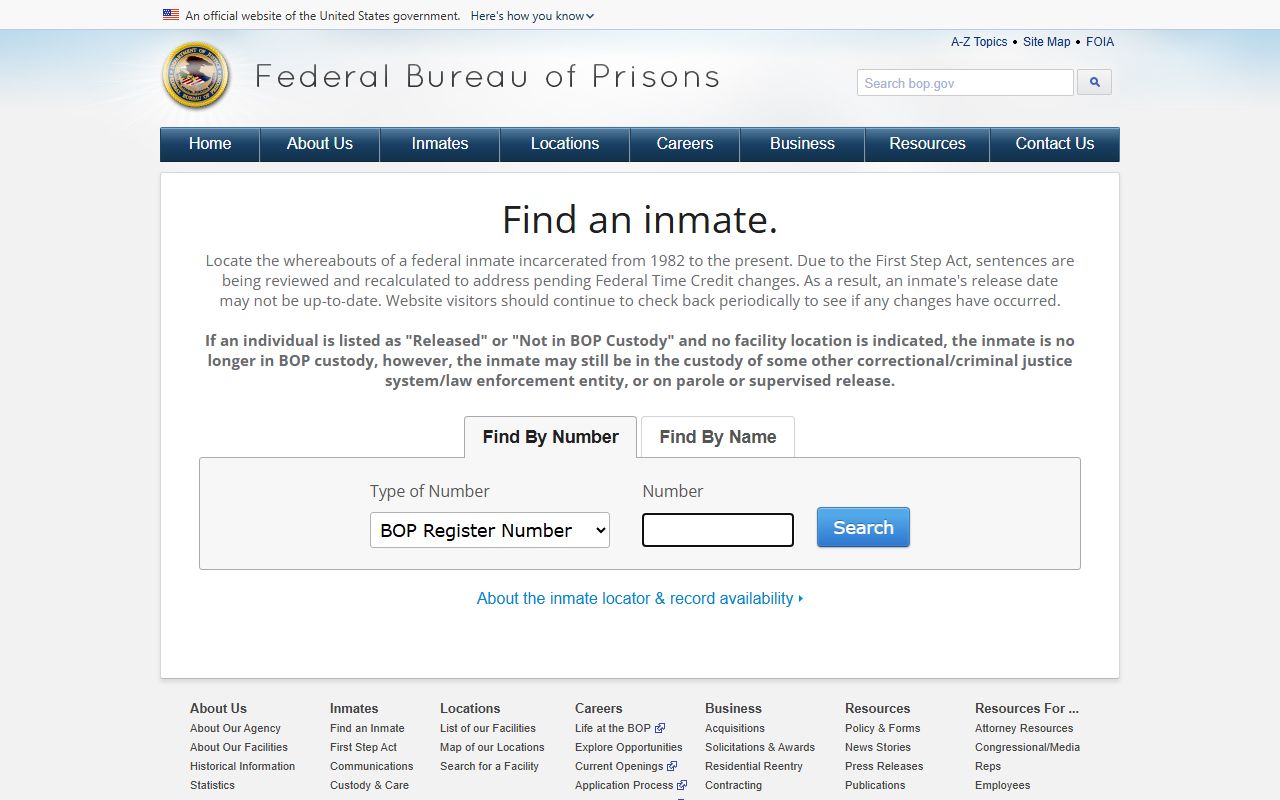
Keep the two apart: a federal number never appears in the Santa Cruz County jail count.
Where the Data Comes From
Good data has a clear source. County figures come from the Sheriff, the grand jury, and county criminal justice reports. State figures come from the BSCC Jail Profile Survey. To track an individual's custody status changes, a notification service is the tool, not the population data.
The VINELink service sends custody-status alerts for individuals, separate from the aggregate population data.
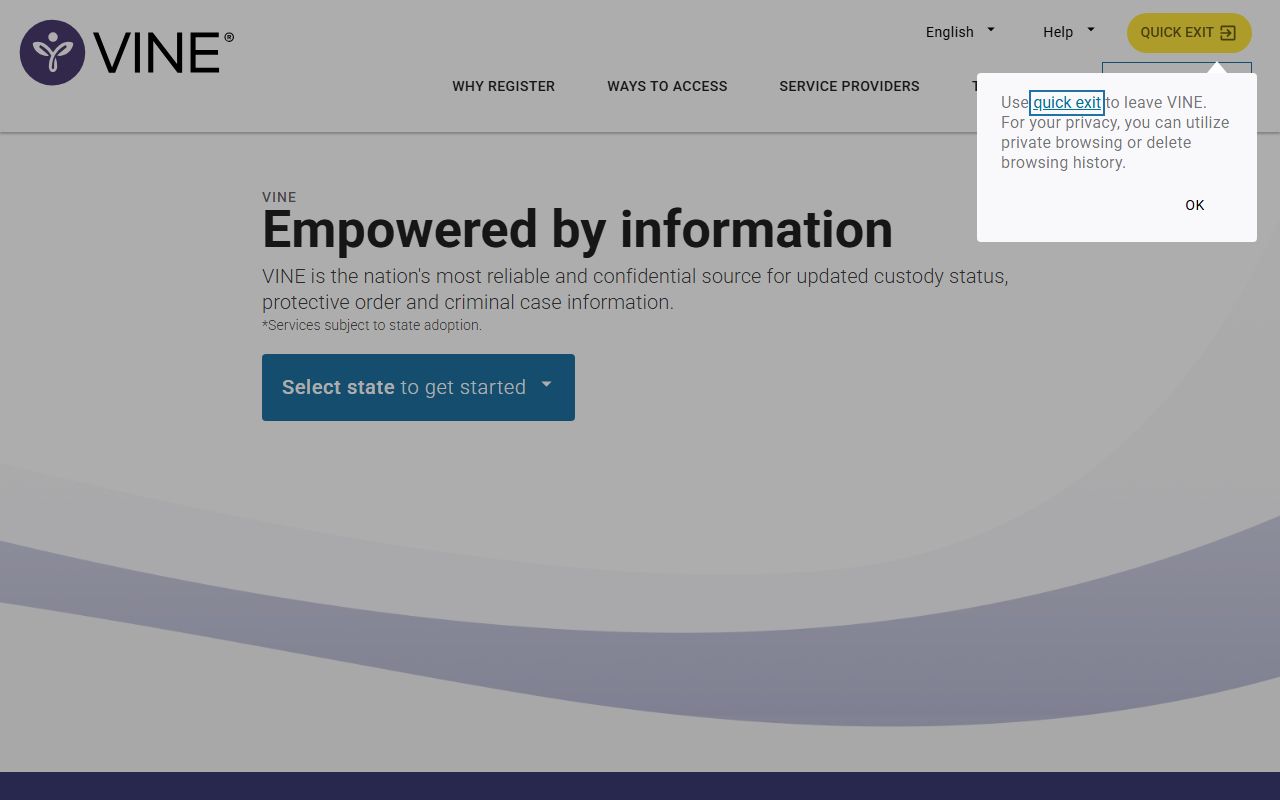
Use population reports for the count, and VINELink or the roster for a single person.
Note: Verify any Santa Cruz County jail figure against the BSCC survey or the county report before publishing, since public snapshots can be dated.